Economic Growth: America vs New France in the colonial era (1700-1750)

As some of you might have glanced, I am also using this blog to hone some of my research by sharing some elements of it with the greater public. It also allows me to reflect appropriately on some issues relating to the economic history of Canada. In that regard, I always felt that little benchmarking of economic performance between the Canadian colonies and the American states (up until Confederation in 1867) which impoverished any analysis of the economic path followed by North American economies (and whether or not America was really “exceptional”).

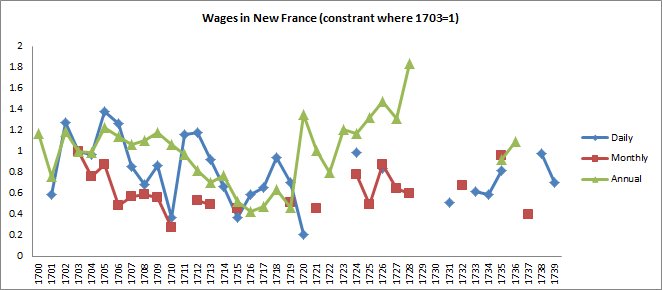
To answer part of that question, at least during the colonial era (circa 1700 to circa 1760), I decided to recreate a better data set of GDP per capita in New France. There was already a dataset produced by Morris Altman in the William and Mary Quarterly in the late 1980s. However, that dataset used fixed prices of 1749. In short, all measures of production were multiplied by the prices observed in 1749 which assumes that prices did not fluctuate much. As I pointed out in this working paper, prices were very volatile and that assumption undermines the quality of Altman’s pioneering efforts (which were made when computers were … well… dinosaurs). Moreover, most assumption use fixed quantities over time. The most problematic of which was to assume that workers in agriculture were exclusively agricultural – a very dubious hypothesis. Hence, I thought that using estimates of the labour requirements of an acre of land  plowed or pastured (Craig Muldrew estimates this at 18.5 days in late 18th century England) would give me the share of potential labour inputs free for non-agricultural purposes. Afterwars, this share needs simply to be multiplied by nominal wages. Hence, it captures total income better and considers the effects of relative price changes between hinterland goods and urban goods.

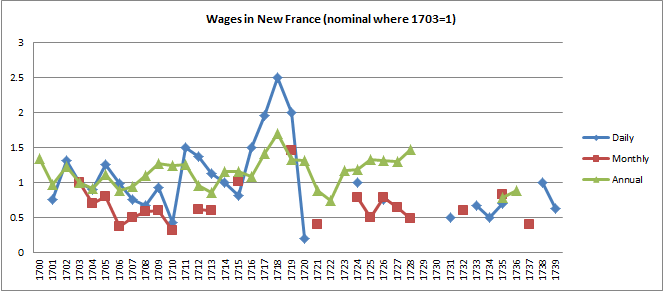
Since I collected new data about prices and wages from the Archives of the Séminaire de Québec and the Archives of the Ursulines de Québec, I felt like I could improve on the work of Altman and produce new estimates of GDP per capita in New France. Here are the results. They show that New France had a constant decline in real per capita output from 1706 to 1719 – years of war and inflation (as a result of the colonial administration’s decision to issue money on playing cards). Afterwards, the economy seems to adapt. This seems consistent with real business cycle theory: there was a shock on productivity as a result of war and inflation. Once the war ended and the administration stopped its monetary experiments, growth recovered to the pre-war level. However, it did not increase from 1720 to 1739.

NewFranceGDP

Overall, the time trend shows that New France’s per capita income grew at 0.13% per annum from 1706 to 1739. This pitiful growth rate is dominated by the effects of the recovery after real shocks (war and inflation – 1706 to 1719 and the harvest failure of 1737). Compared to the trend observed in the American colonies, Quebec was a poor performer. Estimates of growth show figures variating between 0.3% and 0.6% per annum (here, here and here and also here) for the period from circa 1700 to circa 1750.

There is another damning piece of evidence for the economic performance in the pre-british era : agricultural productivity. The value of what was produced per acre of worked (cultivated and meadow) land declined constantly. On this basis, the trend is minus  0.49% per annum, most of this productivity decline happened after 1720. In short, farmers in New France only decided to increase their use of inputs which increasing the efficiency per usage. In fact, they sacrified productivity for production. They worked the land industriously to increase their income. As long as land was available, this could sustain a stable standard of living, but eventually, declining marginal returns would have kicked in and the economy would have begun to contract.

So, here is a short summary of what I am trying to say

  1. American economic growth has not been adequately benchmarked to other similar economies
  2. New France’s economic performance is a good benchmark for the US’s economic performance
  3. The estimates available for New France should be improved and updated
  4. New France’s economic growth per capita stood at 0.13% per annum and more or less stagnated from 1720 to 1739
  5. Compared to New France, economic growth in the American colonies was exceptional
  6. All the growth observed in New France is the result of a more extensive use of inputs rather than a more efficient one. A situation bound to generate economic contraction in the long run.


The political economy of nominal wage rigidity

I’ve been reading up in recent months on monetary economics (I admit to have abandonned any interest in the field years ago, but my interest was sparked in light of the nomination of Janet Yellen). To the horror of my austrian friends, I admit that the “market monetarism” of Scott Sumner and Lars Christensen is the framework of analysis that I find the most theoretically compelling. Yet, there is one thing I am always amazed by with regards wage and price flexibility: there are no public choice approach to why wages and prices are flexible.

For all it seems, private sector wages are flexibleThey are not fully flexible, but they do exhibit a high level of flexibility. Similar outcomes have been observed in other countries. Scott Sumner has a reply to this issue, partially inspired from Krugman. Yet I am not convinced because there is no breakup of public and private sector employment.

I would not be surprised to find that there is little or no downward flexibility in wages for public sector employment. The reason for this is that public sector employment have a greater level of employment security. This was lobbied for by public sector unions, who by virtue of being the sole providers of public services, managed to coerce politicians into not only granting them employment security but also a wage premium (all things being equal). For example, the Fraser Institute institutes argues that the wage premium in the public sector is 12% in Canada. If public sector employment is 25%, this represents a 3% tax on the economy as a whole. In a recession, the premium stays stable. However, since private sector payrolls increase and profits collapse , the relative weight of the tax increases because the public sector is not affected by the downturn.  Hence, wages for public sector employees, which in countries like Canada represent a large chunk of total employment, are probably creating a high level of rigidity. The costs of rigidity and the wage premium (slower adjustments to changes in aggregate supply or aggregate demand and distorted relative prices) are assumed by the private sector. The benefits go to the sizeable minority of publicly employed individuals.  The costs, dispersed over a large population, are mininal on a per capita basis, but the distribution of welfare from this incites public sector unions to lobby and demand such rigidity. I believe there is a public choice argument to make about macroeconomics and wage rigidity – which I have yet to find in the literature.

This leads to a possible suggestion: when public sector employment is beyond the optimal point (where labour could be employed more productively elsewhere with or without a wage premium), public sector payrolls may contribute to prolong the recession. This would have the effect of working against any monetary policy designed to countermand any shocks on money velocity, hence “fiscal policy” (government spending) is conflicting with “monetary policy” that would aim to expand aggregate demand.

Wages in New France, 1700-1739

In collecting price data for New France which is a chapter in my thesis, I discovered data on wages during the era of French rule. Most of the existing data about wages concerns skilled labour, which was scarce and growing scarcer as the colony deurbanized from 1700 to 1760. Although the data I collected does not specify always what was the labour employed, the Séminaire de Québec (an institution operated by religious officials which kept very exhaustive account books) mostly hired labourers on the farms it owned and individuals who also possessed farms. In short, this was actually closer to non-specialized labour and more representative of what work individuals who shifted labour inputs between farming and other complementary activities. This dataset contained 423 observations of wage paid from 1700 to 1739. These are 423 observations spread over three types of labour duration (daily, monthly, annual).The largest sample comes from annual observations which was often contracted for transporting for the séminaire, labouring and plowing fields, clearing land, building fences etc. The annualized data is probably the most reliable. However, the data collection is not finished especially since I have yet to complete the account books after 1728. At present, all data that is annual and prior to 1728 is probably the best in the sample (I will present finalized results when completed).

This is a small sample, I wish I had a larger one, but it is at least indicative of what non-specialized workers were paid and the overall population was already very small (in 1739, there were less than 50,000 souls in the colony). However, this sample could be useful in the future in order to derive better estimates of output per capita in the colony and measure the economic growth of the colony (or at least possess a counter-reference point to confirm other trends). The graph below illustrates the index of nominal wages. 

NewFrance

If we attempt to use the price index I constructed in New France (see here), we can obtain a better image of how real wages evolved in the colony. The intesting result is what happens to wages from 1710 to 1728. These are the years of the disastrous Walker expedition in Quebec (a failed British invasion), the period of lax monetary policy of the french administration (when it issued notes signed on playing cards) and the post-war adjustments. As one can see, real wages fell considerably from 1710 to 1719 and then rebounded to very high levels by 1728 (which were well above the 1703 levels).

NewFranceReal

This leads me to a huge question, if wages were increasing in the postwar period (and according to other sources, wages in skilled crafts were also increasing), why would people resort to farming (land plowed increased much faster than population growth) and exit the cities where higher real wages could be commanded? I have a feeling that, if I am forced to ask this question, individuals were probably resorting to second-best options to farm industriously (and not productively since agricultural productivity was declining in the years of french rule).

I think that these confirm the implication I underlined in my working paper on prices in New France. I underlined that relative to domestic non-agricultural goods, the purchasing power of agricultural produces like wheat were barely holding their ground and others like oats and peas were clearly loosing ground.  Meanwhile, relative to the prices of imported goods (over which Quebec was merely a price-taker and possessed no influence over their fluctuations), wheat actually stayed stable or increased its purchasing power:

The share of the labour force operating in non-agricultural venues has a strong impact in the determination of prices for non-agricultural domestically produced goods. However, it does not have any effect on the price of foreign goods especially since Quebec was a very small market with very little or no influence on foreign prices. In this situation, the deterioration in the relative purchasing power of wheat to other domestic goods indicates the possibility that the agricultural labour force was increasing rapidly at the expense of other sectors that would have to pay higher wages to attract workers in their industries. Normally, higher wages in domestic industries should have eventually attracted workers to non-agricultural venues of employment and the economy should have grown increasingly more specialized. Yet, this is not what happened since the population abandoned cities in favour of the hinterland and increased the surface of land they plowed at the expense of productivity. The concurring trends described above in line with this logic suggest that what was happening in Quebec was a “second-best” approach to optimizing living standards. In short, the colonists in New France farmed wheat industriously even if the marginal productivity of each additional input was declining.

I think that the annual wage data confirm this instinct, albeit imperfectly. They confirm the fact that wages were higher in city and were growing.

12 years a slave and the economics of slavery in the Antebellum south

I went to the movies last week with my much better half and we decided to watch the emotionnally demanding, 12 years a slave. At many turns, I felt like crying and the scenes were moving (in spite of Brad Pitt’s shameless depiction of the hero who saved Northup from slavery). However, I also noticed many things that are related to the economics of slavery (I like this review article by Thomas Weiss in 1974 of Time on the Cross). These elements, by pure coincidence, ended up being discussed in the graduate class I am giving at HEC Montréal on economic history.

I was trying to explain to student (in the introductory class on institutions) that institutions may persist in spite of generating results below was could be considered to be the optimal thing. In short, institutions can generate a net welfare loss but still persist. I suggested that slavery made investments in slaves more profitable, artificially depreciating investments in improving free labour productivity (like building railroads). Since all the gains from investments in slaves were fully captured by owners, it was better to increase the productivity of slaves (from the owner’s perspective). Moreover, it was more profitable for a slaveowner to invest in labour-intensive methods of production. The reason for this being that the owner taxed the leisure of slaves by making them work more and gained all the proceeds from their work and the foregone leisure of slaves. Consequently, incentives ran in favor of simply increasing the use of inputs rather than increasing productivity of their use. It also incited, as Thomas Sowell pointed out in Markets and Minorities, many individuals to supply the demand of slaveowners for coercition upon slaves  (by becoming specialized in hunting down runaway slaves). In short, the dynamic play of the institution was to redistribution welfare in favor of a few and incite behaviours that were less conducive to growth. Although I am not an expert on the economics of slavery, the illustration is a great example of socially non-optimal institutions that have impressive lifespans.

Then, my co-teacher (the class is given by one economics professor and one management professor) mentionned the movie 12 years a slave. She pointed out that many elements of the discussion were well illustrated in the movie. I thought it might be interesting to point out those that I saw and remember for the benefit of my students and my blog readers.

1: William Ford: The most benevolent of the slaveowner who seemed to be resentful of cruelty upon slave. The man seemed like a pawn in a game in which there were little incentives, financially, to defect from the consensus. First of all, Ford was stuck in path dependency by having large investments in the form of slaves (a part of which must have been contracted by heritage). Despite obvious moral objections, he could ill-afford to defect especially when the white carpenter, Tibeats, becomes a threat to his own family – forcing Ford to sell Northup to the cruel Edwin Epps. This is a very good illustration of why the system of slavery must have been preserved, as pointed out by Jeffrey Hummel, by political devices which prevented the defection of men who, like Ford and Robert E.Lee (the latter hated slavery in spite of fighting for the Confederacy), to defect.

2: Not allowing Northup to own money: To follow up on the previous point, it should be noted that Northup was allowed to gain money from playing violin on the count of Judge Turner while being on lease from Edwin Epps. Yet, had Northup played the violin often, he could have eventually earned sufficient to engage in a mutually beneficial arrangement to buy his freedom from Epps or Ford. The problem is that, as Sowell pointed out, voluntary manumission was illegal : slaves and slaveowners were prohibited (or at least severely restrained) to engage in any sort of dealings to sell freedom. As pointed out earlier, political devices were in place to prevent defection from the system of slavery.

3: The slave-catchers: The two men who abducted Northup were paid to do so and so were the men who caught runaway slaves without tags from their owners. Normally, such a market for skills would not exist. But the institution of slavery created its own spawns and children by creating a market for capturing free blacks and recapturing runaways. This created an additional political force to oppose any reforms of the system. Rent-seeking was the name of the game.

4: Cutting on leisure time: when Epps decides to wake his slaves up in the middle of the night to dance, he cut in their “leisure” time (if one can call sleeping “leisure”). In a way, he taxed their leisure for his benefits and made them work anyways because he captured all the proceeds from their work.

5: The fear of an educated slave: an educated slave was one who could, basically, read a map and escape from Georgia to Canada. Clearly, if your capital investment knows how to run away from you and you paid 1,000$ for him (back in 1841) then you must be freaking out.

These are the ones I remember noticing, did anyone see any other elements?

Note: I discovered this article which is worth reading for those interested in the issue

Market integration between Upper and Lower Canada, 1787-1858

Still in line with my articles regarding market integration in Canada prior to confederation, I am posting what prices in Ontario looked like before 1845 and between the different regions. It seems that prices were moving together and closely together.

MArketInterUCLC

But more interestingly is the integration between the Lower Canadian district of Montreal and Central Ontario which is a trend that is strenghtening in the 1820s up to the late 1850s. The graph below illustrates the coefficient of variation between the different markets, the higher (lower) the coefficient is, the more (less) disintegrated the pair of markets are. This is an important trend in the early development of the Canadian economy which have not yet been illustrated empirically. It means that markets are operating closer to what we could qualify as the efficient market hypothesis. Since arbitrage opportunities could be exploited, specialization and a lesser reliance on agriculture would likely have become possible during that period.

MarketInterCOMtl